Path finding Visualizer
Table of Contents
1 Description
This is a OCaml script implementing, and visualizing the result and calculation of some path finding algorithms like Dijkstra's and A*. It also have different distance approximations and path optimizing methods.
2 News
- 19 Aug 2010: v 1.1. Shows all tiles in cloud (not just the first 10).
- 31 Jul 2010: Fixed Linux binary download link, added usage information.
- 30 Jul 2010: Page creation.
3 Files
I couldn't figure out how to compile the OCaml Curses bindings on Windows, so no Windows binary.
- Linux binary: pathvisual v 1.1, 19 Aug 2010
- Source: pathvisual1.1.tar.gz v 1.1, 19 Aug 2010
- Source: pathvisual1.0.tar.gz v 1.0, 30 Jul 2010
4 Usage
- Linux binary:
- Must be run from a terminnal
chmod +x pathvisual./pathvisual
- Compiling on Ubuntu
tar xzvf pathvisual_1.1.tar.gzcd pathvisualsudo apt-get install ocaml libcurses-ocaml libcurses-ocaml-dev(libcurses-ocaml is in universe)make./pathvisual
5 Features
- Cave-like territory, implemented from roguebasin.roguelikedevelopment.org
- Also a slow implementation of a properly connected cave (several seconds to generate).
- Path finding algorithms
- Dijkstra's Algorithm
- A*
- Greedy A*. Like A* but only looks at current location's neighbours
- Distance approximation
- Proper Pythagorean
- Approximation |x1 - x2| + |y1 - y2|
- Path finding algorithm visualization
- Show tiles being considered at each step.
- Path optimizer, clean up/optimize a path.
- Good.
- Fast. After a path optimization, continue with path point after the optimized part.
- Path optimizer visualization
- Show each line-of-sight being considered and if it hits a wall.
6 Screenshots
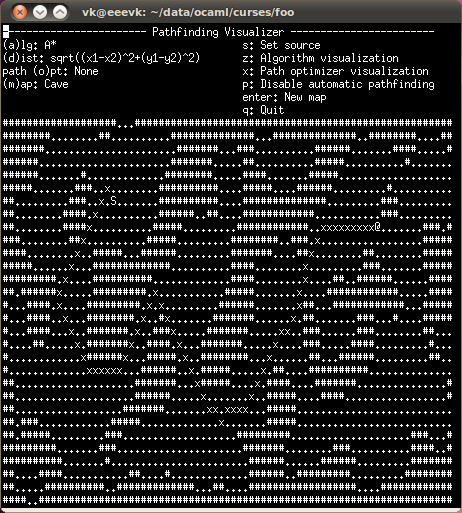
This is a path generated using A*, with the optimal distance algorithm and no path optimization.
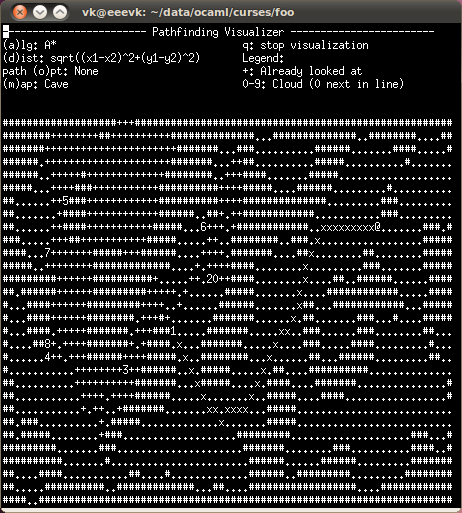
This is the same as in the previous screenshot, but in the middle of a
path finding visualization. The + are tiles already visited. 0 is
the next tile to be considered (for A* this means the tile with the
lowest ("cost from source" + "estimated distance to destination")),
the other numbers are the next 9 tiles to be considered.
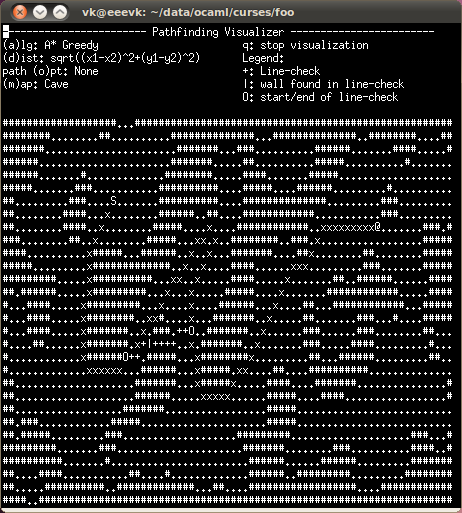
This shows the A* Greedy path finding algorithm in the middle of a
path optimization visualization. The O's are the points on the path
being checked for possible optimization. The + is the line between
the points. And the | is where a wall was found (meaning these 2
points can't be optimized).
7 Why
I wanted to fool around with path finding but had a hard time getting the algorithms working or working fast enough. The solution was adding more and more debugging information, which finally resulted in a visualizer. Also, ML is fun.
8 Ocamldoc
9 Code
I put it all in one big file for no-ones convenience.
#+INCLUDE "pathVisual.ml" src tuareg